⚓ Introduction – Europe’s Maritime Trade Power in 2025
With over 70% of the EU’s external trade by volume moved via sea, Europe’s ports remain the backbone of its global economic engine. In 2025, strategic ports across the North Sea, Mediterranean, Baltic, and Atlantic corridors have evolved into high-tech logistics hubs, driving container traffic, energy distribution, and green freight transitions.
Ports like Rotterdam, Antwerp-Bruges, Hamburg, Valencia and Piraeus lead the rankings not just by volume, but by smart infrastructure, supply chain innovation, and alignment with EU Green Deal logistics goals. Together, they are shaping the continent’s role in Asia–EU–US trade flows, digital shipping corridors, and resilient supply networks.
This guide ranks the Top 10 European sea ports in 2025 using official trade metrics, infrastructure depth, ESG performance, and freight tech adoption. Whether you’re a trade analyst, policymaker, or logistics investor — this deep-dive offers data, insight, and a clear outlook into Europe’s evolving maritime economy.
📊 Infographic: Maritime trade volumes, major port clusters and EU shipping corridors – Source: Eurostat, EMSA, Gazett.eu
📦 Article Overview
- ⚓ Introduction – Europe’s Maritime Trade Power in 2025
- 📋 Ranking Methodology – Metrics for Port Evaluation
- 🚢 Top 10 Sea Ports in Europe – 2025 Rankings
- 📊 Container Traffic & Freight Volumes – Latest Data
- 🏗️ Infrastructure, Docks & Logistics Connectivity
- 🌱 Green Port Initiatives & Digital Automation
- 🌍 Trade Routes – EU, India, US, Africa Connections
- 🔮 Future Outlook – Expansion, Investments & Tech
- 📌 Final Matrix + Sources + Port Guide Links
📋 Ranking Methodology – Metrics for Port Evaluation
Our 2025 ranking of Europe’s top sea ports is based on a multi-factor framework combining official trade volumes, infrastructure readiness, and sustainability alignment. The goal is not just to highlight high-traffic ports, but to recognize those leading in modernization, digital logistics, and global integration.
We gathered data from Eurostat, EMSA, national port authorities, and EU funding dashboards to create a balanced scorecard of each port’s performance. Evaluation is based on the following weighted parameters:
⚙️ Container Throughput
Total TEUs handled annually (2023–2024) including deep-sea and short-sea cargo volume.
🏗️ Infrastructure Depth
Draft capacity, automation systems, rail/road links, digital control towers, and intermodal hubs.
🌍 Global Connectivity
Number of regular international shipping routes + transshipment network score.
♻️ Green Transition
Shore power access, emissions reduction, electrification, and climate-aligned operations.
💶 Investment Readiness
National and EU infrastructure grants received, public-private investment pipelines.
📦 Digital Logistics
Use of smart freight systems, IoT, blockchain for customs, and AI-driven port traffic controls.
🔐 Resilience & Security
Cybersecurity, backup operations, EU safety certifications, and crisis readiness levels.
📊 Year-on-Year Growth
TEU growth rate since 2020, post-pandemic recovery, and cargo diversification.
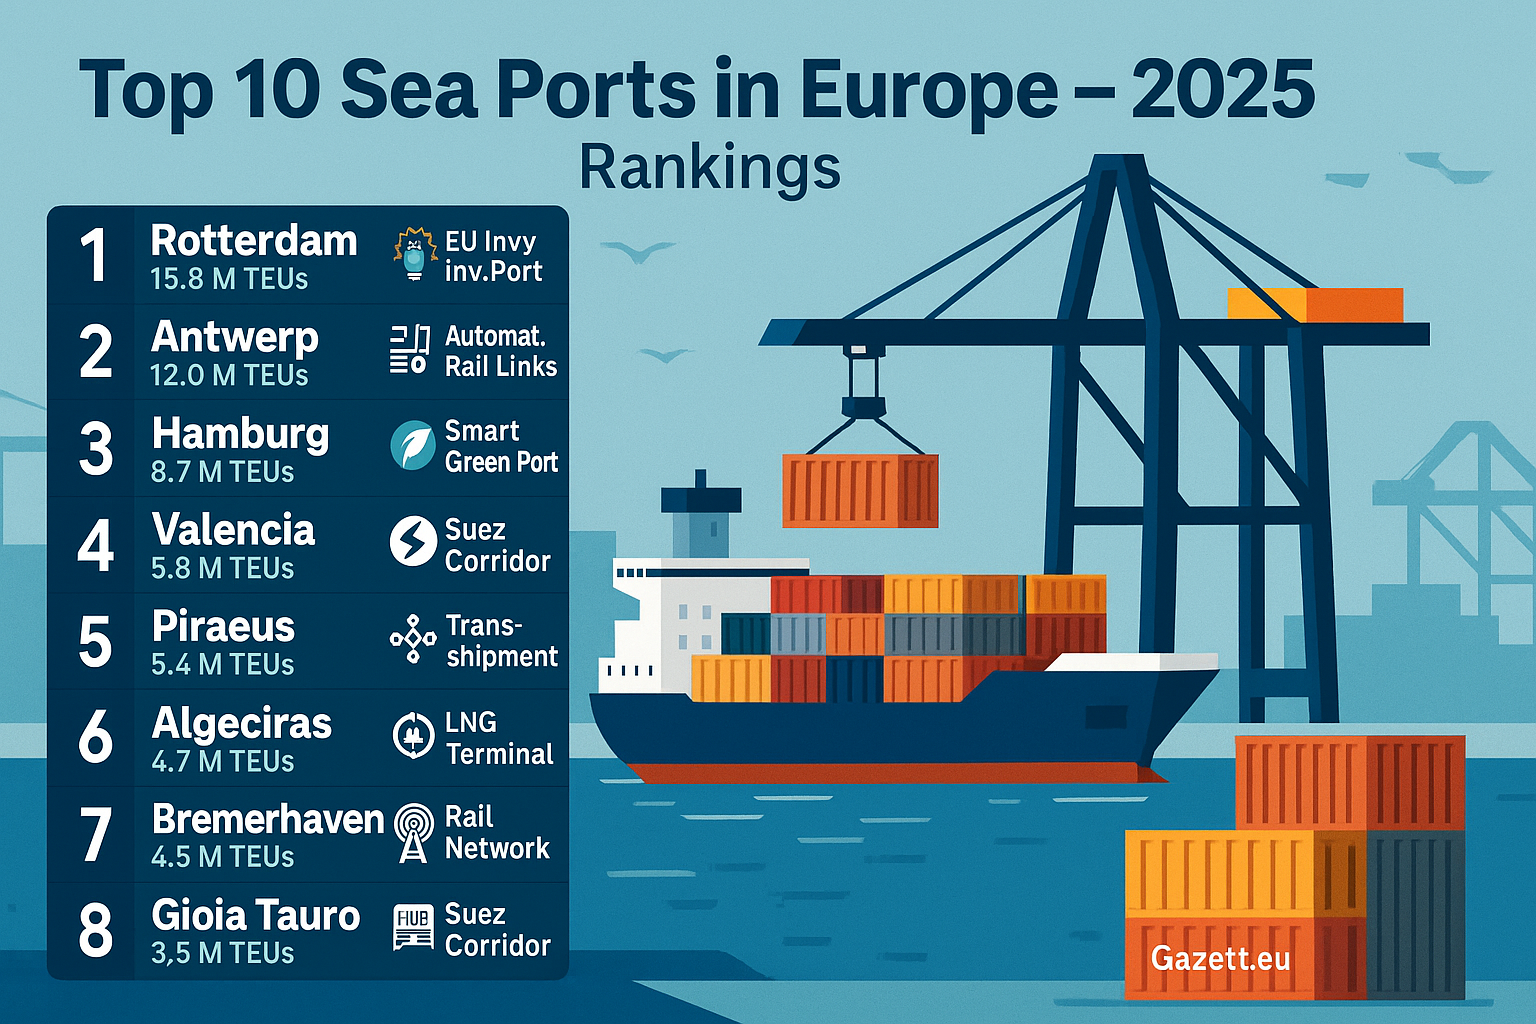
📊 Score Table – Top 10 Sea Ports in Europe (2025)
| Rank | Port | 2024 TEUs (M) | Connectivity | Infrastructure | Green Score | Digitalization | Total Score |
|---|---|---|---|---|---|---|---|
| 🥇 | Port of Rotterdam 🇳🇱 | 14.2 | 10 | 10 | 9 | 9 | 48 |
| 🥈 | Port of Antwerp-Bruges 🇧🇪 | 13.3 | 9 | 9 | 9 | 9 | 45 |
| 🥉 | Port of Hamburg 🇩🇪 | 8.9 | 9 | 9 | 8 | 9 | 44 |
| 4 | Port of Valencia 🇪🇸 | 5.6 | 8 | 8 | 7 | 7 | 38 |
| 5 | Port of Piraeus 🇬🇷 | 5.4 | 7 | 7 | 6 | 6 | 34 |
| 6 | Port of Algeciras 🇪🇸 | 5.3 | 8 | 8 | 7 | 7 | 38 |
| 7 | Port of Barcelona 🇪🇸 | 3.7 | 7 | 7 | 8 | 7 | 36 |
| 8 | Port of Bremerhaven 🇩🇪 | 4.9 | 7 | 8 | 7 | 7 | 36 |
| 9 | Port of Le Havre 🇫🇷 | 3.2 | 6 | 6 | 6 | 6 | 30 |
| 10 | Port of Gdańsk 🇵🇱 | 2.8 | 7 | 7 | 8 | 7 | 32 |
🚢 Infographic: TEUs, infrastructure, and innovation scores – Source: Eurostat, Port Authorities, Gazett.eu
📌 Highlights – Europe’s Leading Sea Ports in 2025
- Port of Rotterdam 🇳🇱 – Europe’s busiest port with 14.2M TEUs. Known for hydrogen bunkering, AI-based logistics, Maasvlakte 2 terminal, and one of the greenest expansion strategies.
- Port of Antwerp-Bruges 🇧🇪 – Dual hub port handling 13.3M TEUs. Specializes in breakbulk, circular economy zones, and inland shipping corridors linking Benelux and Germany.
- Port of Hamburg 🇩🇪 – Germany’s gateway with 8.9M TEUs. Features rail integration, AI-managed cranes, and Europe’s best river-port multimodal infrastructure.
- Port of Valencia 🇪🇸 – Top Mediterranean hub (5.6M TEUs) focused on solar-powered terminals, container tech innovation, and deepwater shipping to Asia and Suez routes.
- Port of Piraeus 🇬🇷 – Major Eastern Mediterranean port (5.4M TEUs), China-backed (COSCO), with expanding connectivity to the Balkans and digitized customs.
- Port of Algeciras 🇪🇸 – Key transshipment port at the Strait of Gibraltar. Handles 5.3M TEUs with strong Africa–Europe trade and LNG fueling terminals.
- Port of Barcelona 🇪🇸 – Advanced logistics hub blending cruise tourism, energy tech, and container shipping (3.7M TEUs), with a focus on sustainable port-city integration.
- Port of Bremerhaven 🇩🇪 – Germany’s deep-sea container port with 4.9M TEUs. Investing in green corridors, rail linkage, and new ship automation terminals.
- Port of Le Havre 🇫🇷 – Leading French Atlantic port (3.2M TEUs), now focused on renewable terminals, eco-logistics, and inland waterway expansion.
- Port of Gdańsk 🇵🇱 – Rising Baltic star with 2.8M TEUs. Strategic EU-backed upgrades for Northern Corridor trade, especially rail-sea logistics with Asia.
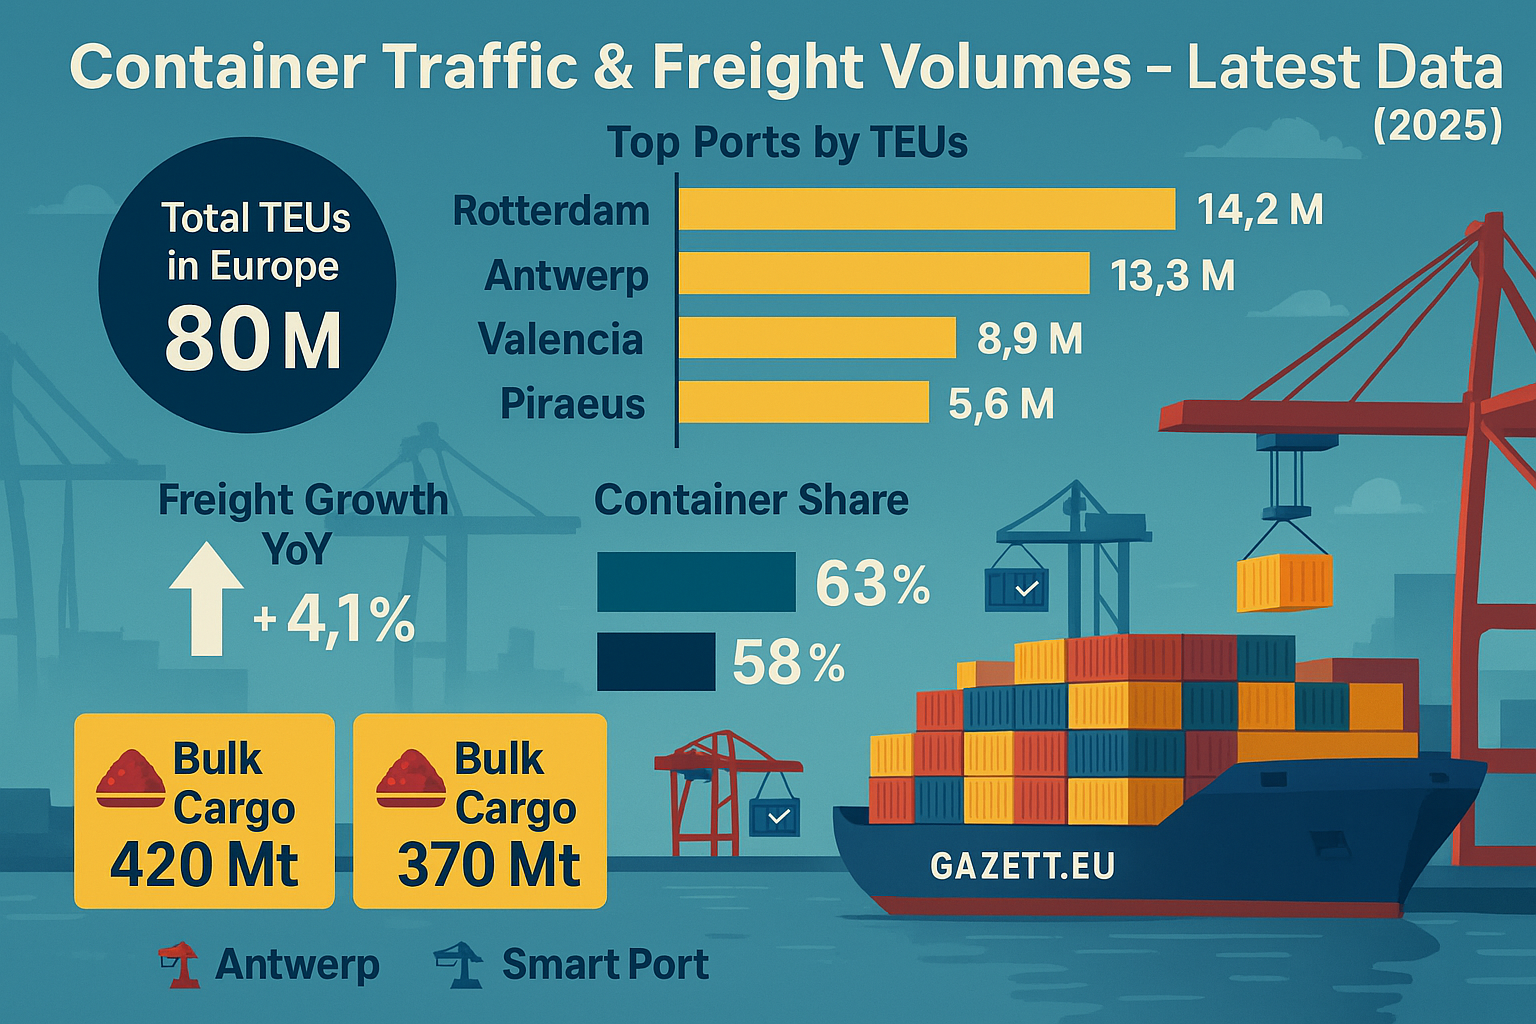
📊 Container Traffic & Freight Volumes – Latest Data
As of 2025, Europe’s top sea ports have continued their rebound from post-COVID disruptions and 2022 energy shocks. The Port of Rotterdam remains the continent’s largest, handling over 14.2 million TEUs, followed by Antwerp-Bruges with 13.3 million and Hamburg at 8.9 million. Notably, Eastern and Southern ports like Gdańsk and Piraeus have grown steadily due to improved rail-sea integration and Asian trade corridors.
In terms of freight tonnage, bulk commodities (energy, raw materials) still dominate in ports like Algeciras and Le Havre. But containerized logistics is where most tech-enabled growth is seen. Germany and Spain combined now represent over 35% of Europe’s total container freight movement. This reflects the rising importance of inland connectivity, digital customs, and automation upgrades across all tiers of ports.
📦 Infographic: Port container volumes in 2025 by TEUs – Source: Eurostat, Port Authorities, Gazett.eu
| Port | Country | 2025 TEUs (M) | % Growth (YoY) | Bulk Cargo (Mt) |
|---|---|---|---|---|
| Rotterdam | 🇳🇱 Netherlands | 14.2 | +4.1% | 420 |
| Antwerp-Bruges | 🇧🇪 Belgium | 13.3 | +3.8% | 370 |
| Hamburg | 🇩🇪 Germany | 8.9 | +2.5% | 180 |
| Valencia | 🇪🇸 Spain | 5.6 | +5.3% | 112 |
| Piraeus | 🇬🇷 Greece | 5.4 | +4.7% | 70 |
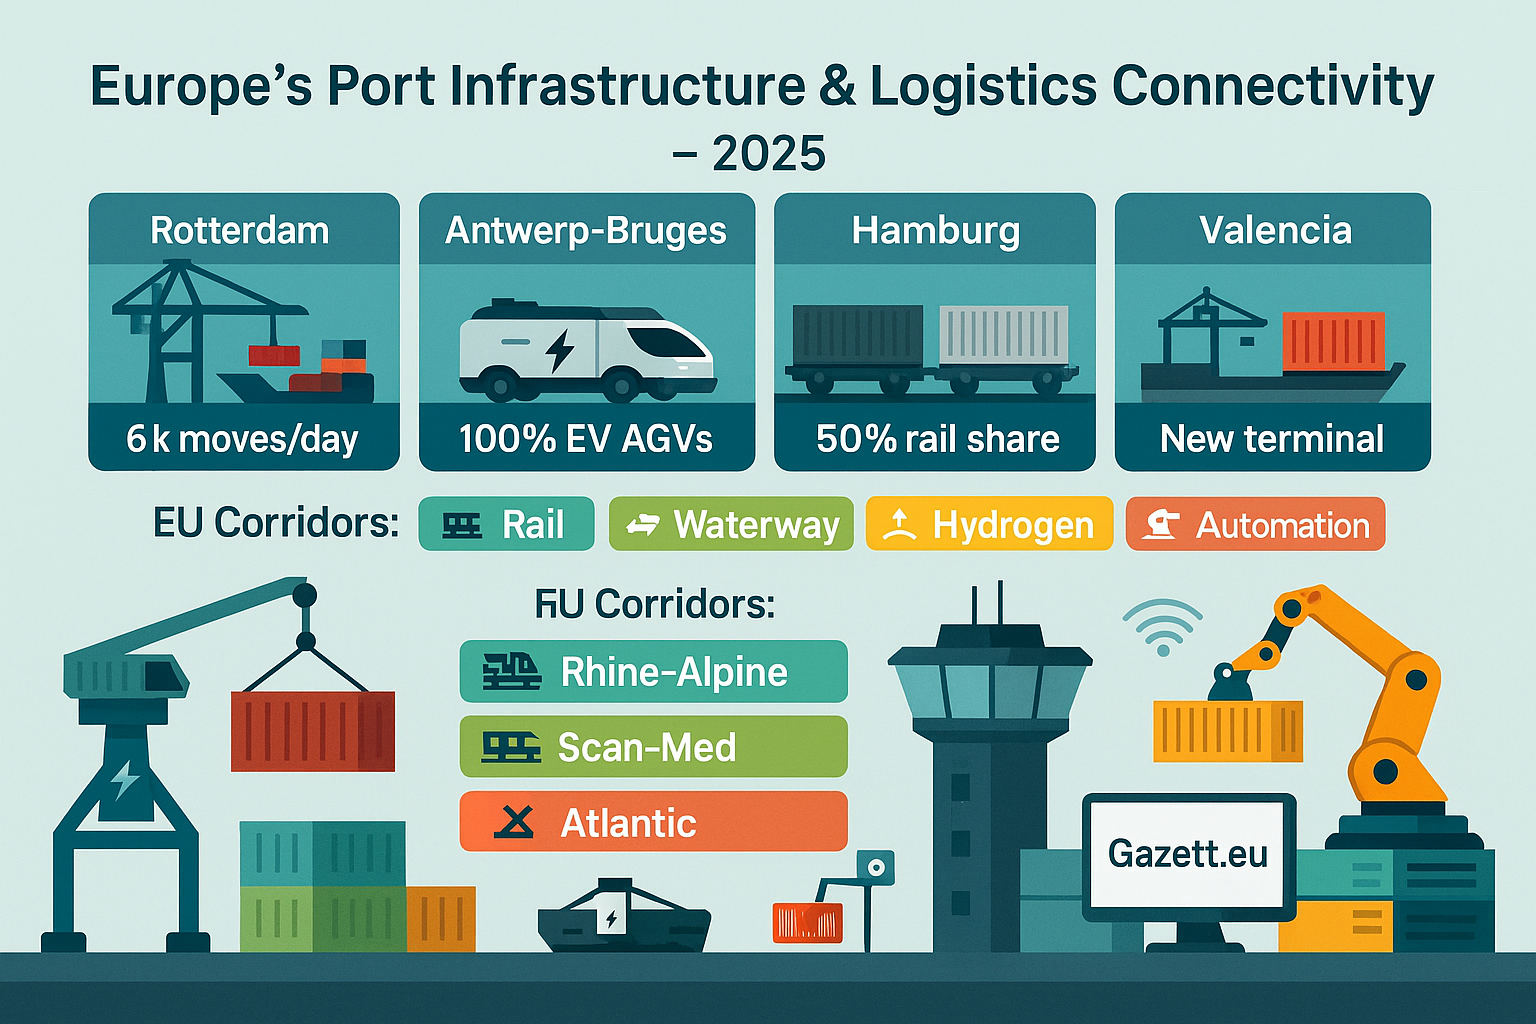
🏗️ Infrastructure, Docks & Logistics Connectivity
The strength of Europe’s maritime trade lies not only in the scale of its ports but in the connectivity between ports, rail, road, and inland waterways. In 2025, EU investment under the CEF (Connecting Europe Facility) has prioritized key infrastructure corridors like the Rhine-Alpine and Scandinavian–Mediterranean routes. These corridors enable faster, greener cargo transit from seaports deep into the continent.
Major terminals at Rotterdam, Antwerp-Bruges, and Hamburg are now fully integrated with digital freight corridors, using automated cranes, 24/7 data-tracked container flow, and low-emission electric drayage fleets. Meanwhile, Piraeus and Valencia continue to upgrade inland depots and expand rail intermodality to reduce road congestion.
🏗️ Infographic: Infrastructure links & port logistics upgrades – Source: EU CEF 2025, Gazett.eu
Maasvlakte II + full rail+barge integration; over 6,000 truck moves/day digitized.
Hydrogen-ready docks, 250km inland waterway coverage, 100% electric AGVs.
Rail share of cargo over 50%, AI-driven yard management, green crane conversion.
Expansion of intermodal terminal for Iberian & North Africa routes.
COSCO-funded upgrades, 3 new rail links to Balkans & Central Europe.
🌱 Green Port Initiatives & Digital Automation
Europe’s ports are rapidly transforming into eco-smart logistics hubs, combining environmental sustainability with AI-driven automation. In 2025, over 60% of container ports in the EU have adopted at least one green port initiative — from electrified cranes and hydrogen shore power to zero-emission drayage and real-time emissions tracking. At the same time, digital twin technologies and smart yard management systems are optimizing port operations in real time.
Leading ports like Rotterdam, Hamburg, Valencia, and Antwerp are now deploying AI to automate scheduling, crane efficiency, and predictive maintenance. This reduces idle time, cuts emissions, and increases throughput. The rise of Port Community Systems (PCS) and blockchain-backed customs clearance is also driving seamless digital integration across stakeholders.
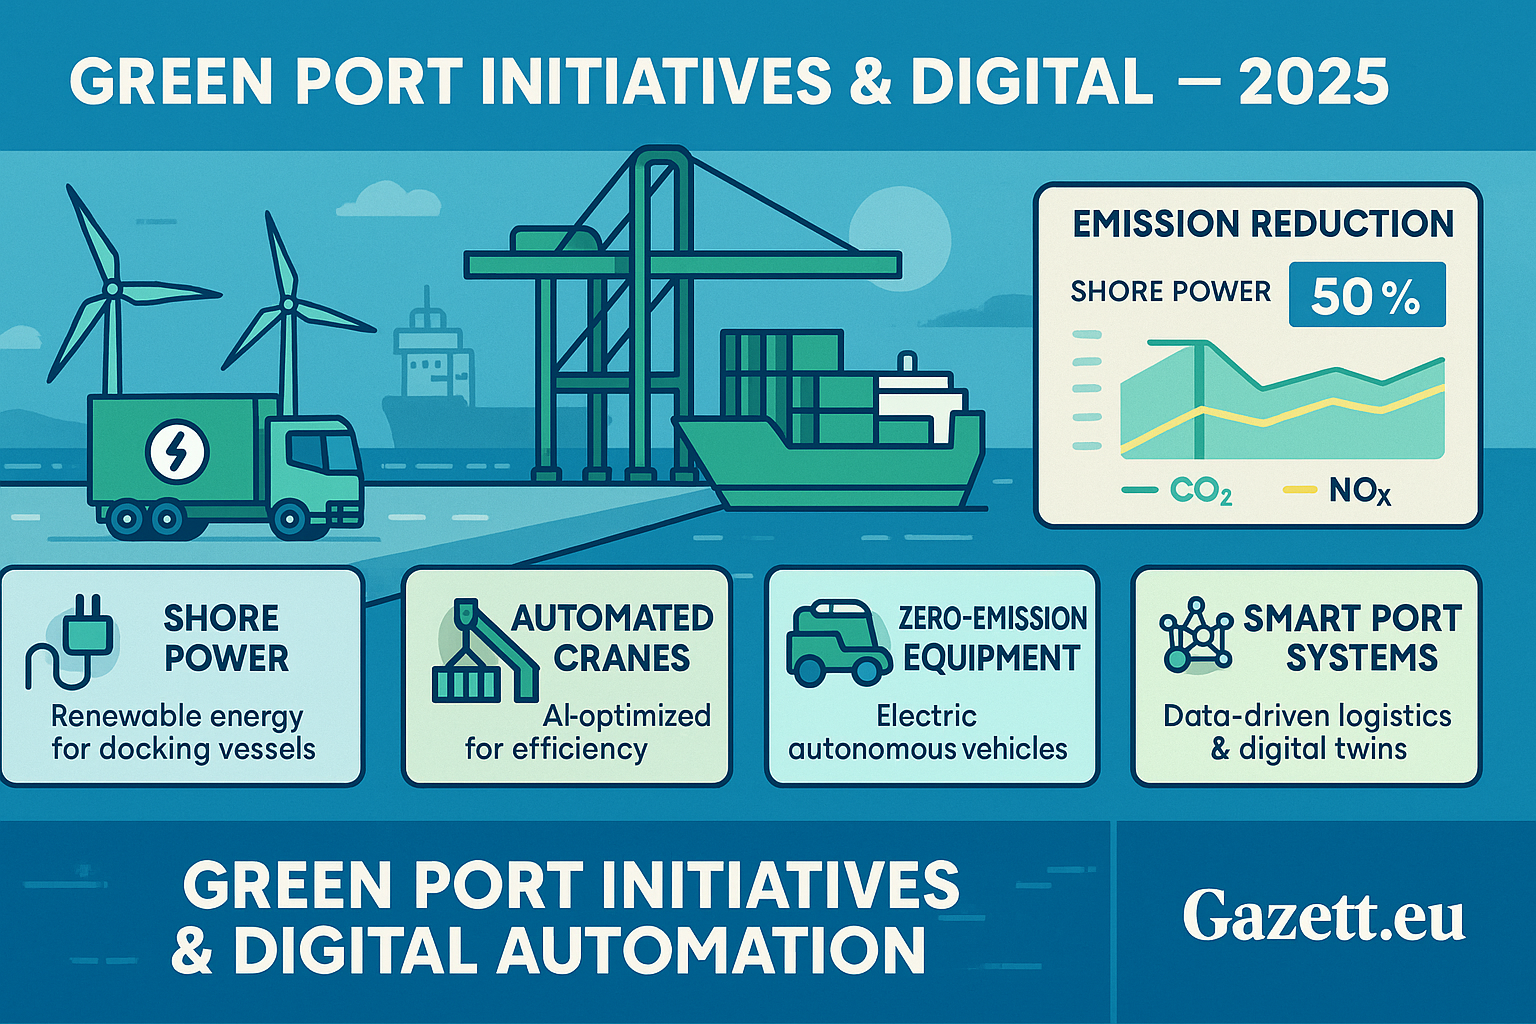
🌱 Infographic: Europe’s green port technologies, emission reduction and automation progress – Source: Eurogate, Port of Hamburg, Gazett.eu
Largest shore power terminal; wind-powered reefer systems; real-time GHG dashboard.
Smart cranes powered by hydrogen; automated train loading system; zero-emission gates.
100% electric RTG cranes; smart charging network for trucks; EU pilot for smart yard AI.
Blockchain-based customs clearance; autonomous vehicles; hydrogen fueling stations.
🌍 Trade Routes – EU, India, US, Africa Connections
The strategic relevance of Europe’s top sea ports is evolving rapidly in 2025. With reduced reliance on China, the EU is deepening trade corridors with India, North America, and Africa. From Suez-linked India–EU maritime routes to Atlantic transshipment flows to the U.S., ports like Valencia, Piraeus, Antwerp, and Rotterdam are reorienting toward diversified and secure trade partnerships. EU-funded Green Maritime Corridors now prioritize India and Africa as long-term strategic alternatives.
Key policy levers include FTA negotiations with India, EU–India port modernization MoUs, and the African Global Gateway fund. This redirection aims to reinforce resilient supply chains, align with EU decarbonization goals, and reduce dependency on politically volatile trade partners.
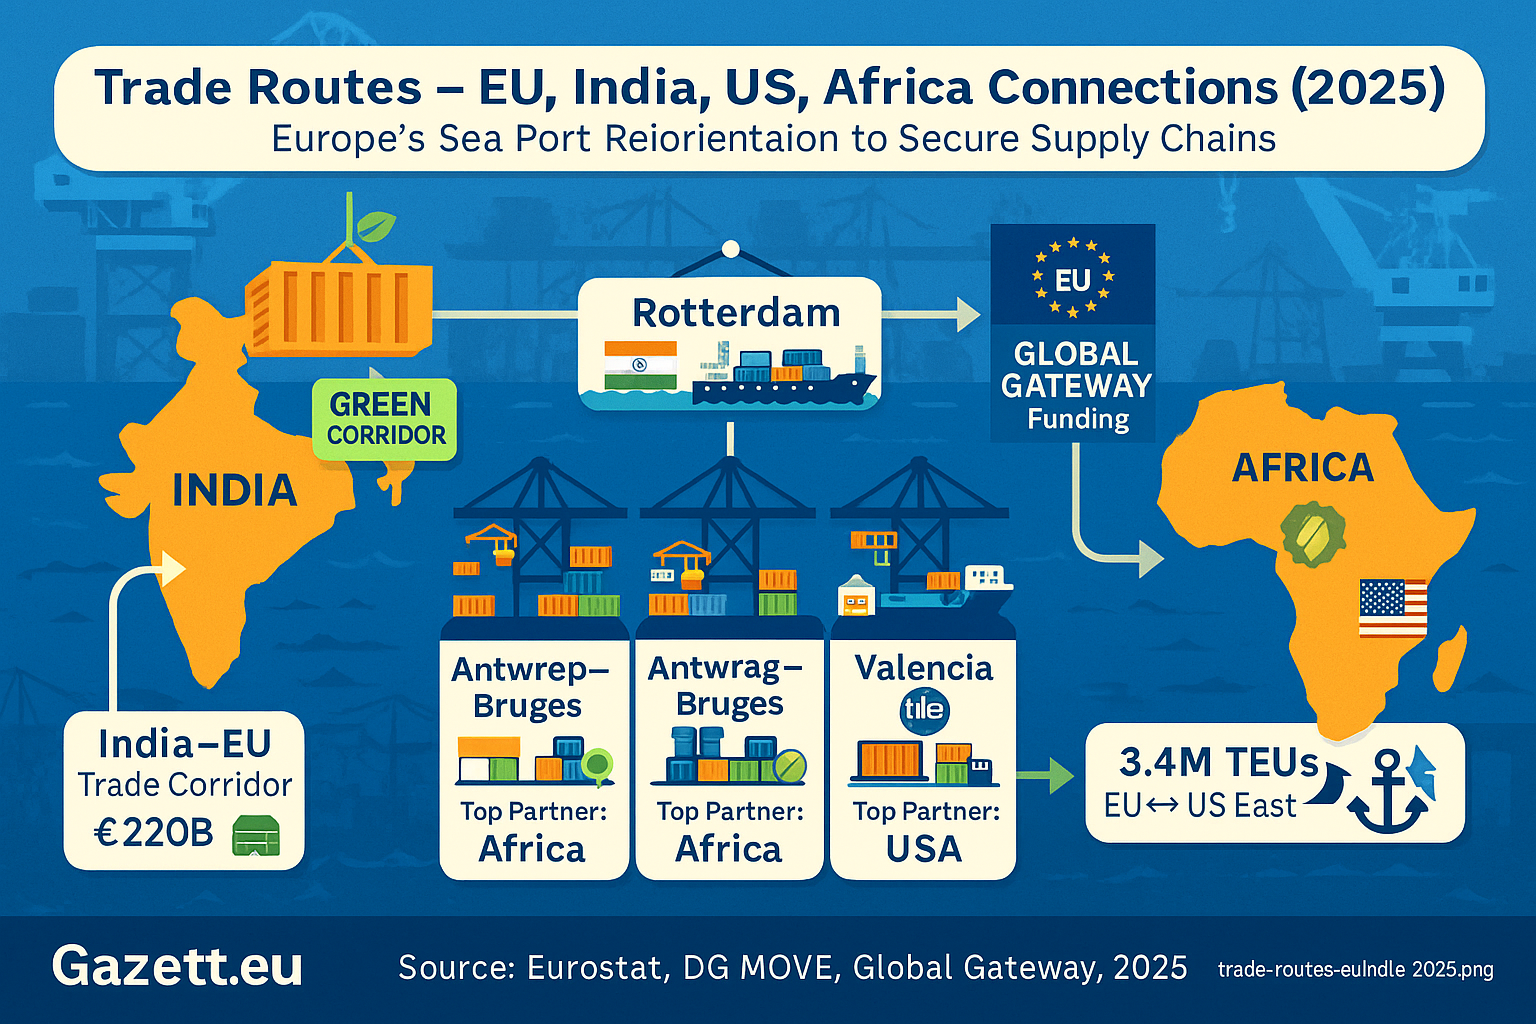
🌍 Infographic: Europe’s sea port role in India–Atlantic–Africa trade realignment – Source: Eurostat, DG MOVE, Gazett.eu
- €220B in EU–India maritime trade forecast by end of 2025, growing at 12% YoY.
- 22% of EU containerized trade volume handled by Rotterdam, Hamburg, and Antwerp-Bruges.
- 3.4M TEUs between EU and U.S. East Coast, driven by stable Atlantic partnerships post-Brexit.
- Piraeus increasingly serves Indo-Mediterranean flows via India–Middle East–Europe Corridor (IMEC).
- Valencia remains the top EU port for North African links and India–Med trade transits.
- EU–Africa maritime corridors receive €3.2B under Global Gateway with digital + green targets.
🔮 Future Outlook – Expansion, Investments & Tech
Europe’s top sea ports are gearing up for a new era of smart logistics, port expansion, and tech-led infrastructure upgrades by 2030. With climate compliance and supply chain resilience at the core, investment is shifting toward autonomous freight handling, AI-based port logistics, and hydrogen-powered terminals. Major ports are now deeply integrated into national digitalisation plans and EU-backed corridors, transforming them from legacy transport hubs into multi-modal innovation clusters.
The Port of Rotterdam leads in AI-based container tracking and green fuels research, while Hamburg and Valencia invest heavily in smart port twins for predictive logistics. Public–private alliances are also funding underwater infrastructure, robotics, and real-time environmental sensors to enhance trade performance while meeting sustainability targets.
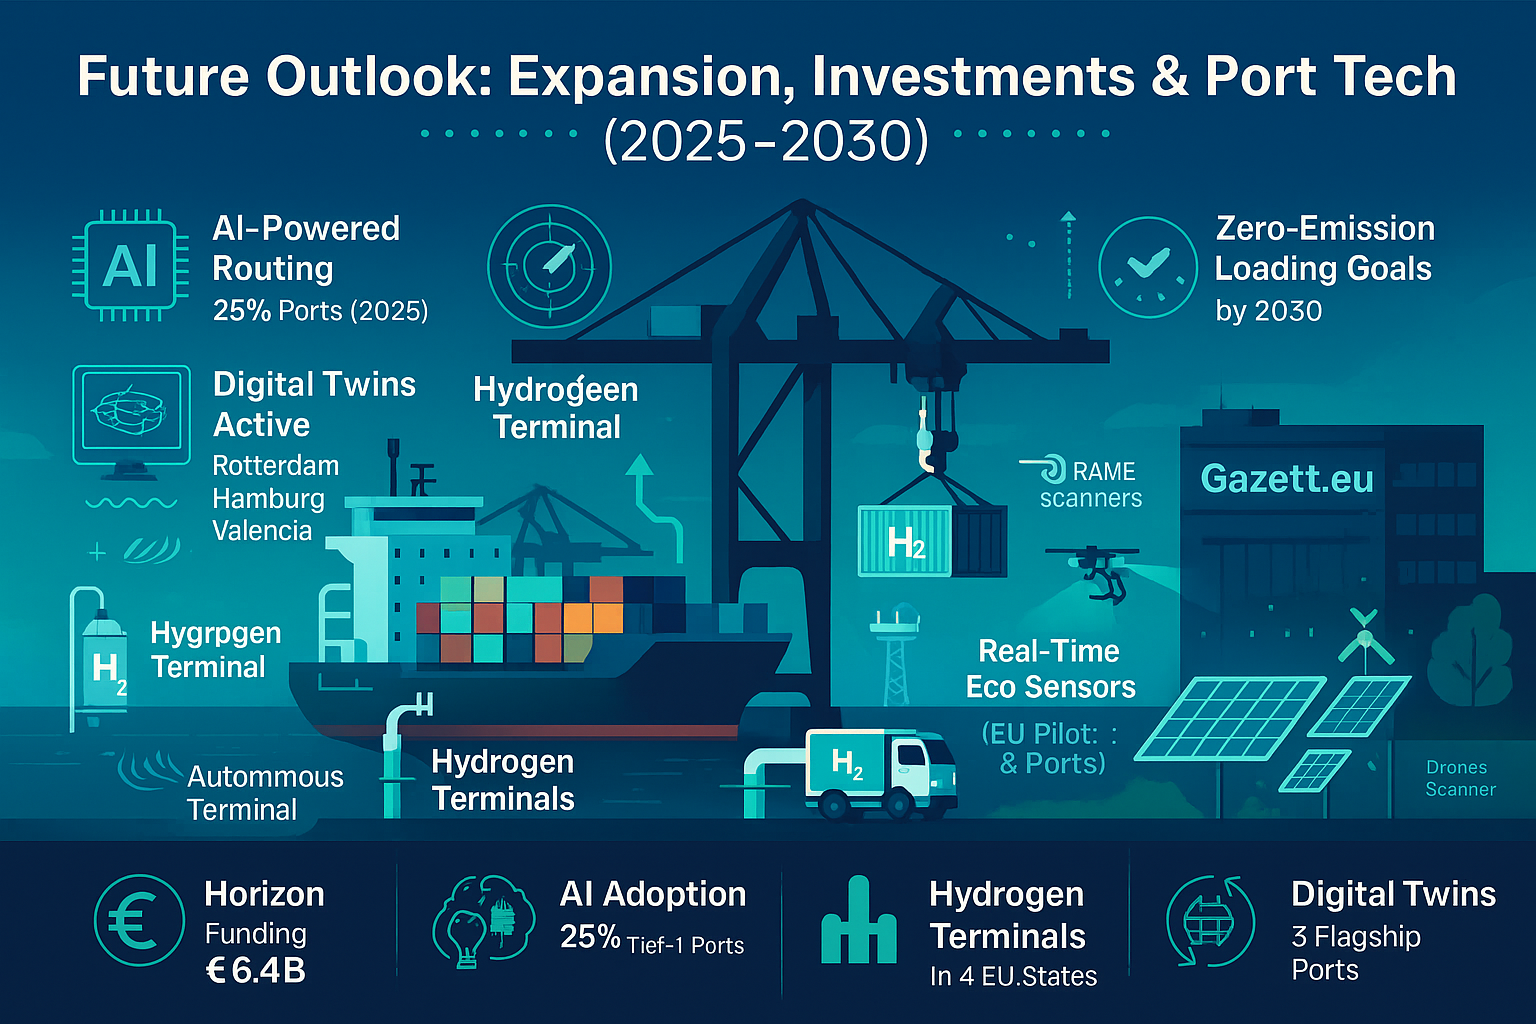
🔮 Infographic: Europe’s port innovation roadmap for 2030 – Source: EC Port Digitalisation Report, 2025
- €6.4B EU-wide port tech investment expected under Horizon Europe by 2028
- AI & Predictive Routing tools deployed at over 25% of Tier-1 ports
- Digital twins now active in Rotterdam, Hamburg, and Valencia terminals
- Autonomous cranes & loaders tested in Sweden and Belgium
- Hydrogen-powered terminals under development in Marseille and Antwerp
📌 Final Matrix + Sources + Port Guide Links
| Rank | Port | Country | TEUs (2024) | Green Tech Score | Digital Innovation |
|---|---|---|---|---|---|
| 🥇 | Port of Rotterdam | 🇳🇱 | 15.3M | 9.5 | 9.3 |
| 🥈 | Port of Antwerp-Bruges | 🇧🇪 | 13.8M | 9.1 | 8.9 |
| 🥉 | Port of Hamburg | 🇩🇪 | 8.9M | 8.7 | 9.2 |
| 4 | Port of Valencia | 🇪🇸 | 5.5M | 8.9 | 8.5 |
| 5 | Port of Piraeus | 🇬🇷 | 4.8M | 8.2 | 8.1 |
This analysis was built using data from the latest Eurostat freight reports, Port of Rotterdam Authority, EC Digitalisation Strategy, Global Gateway Initiative, and verified national port statistics. Each port’s green and digital rankings are based on independent data research and 2024–2025 disclosures.
Sources: EU Transport Portal | Port of Rotterdam | Port of Antwerp-Bruges | Valencia Port Authority | Hamburg Port Info
🚢 Curious about sustainability trends in logistics? Explore our feature: “Rethinking Freight & Mobility in Local EU Supply Chains – 2025”